Discuss issues and ideas you have to configuring displays with PowerVision
-
dmsellers
- Posts: 42
- Joined: Mon Aug 12, 2013 7:45 pm
Post
by dmsellers » Tue Dec 30, 2014 6:21 pm
PV Version: 2.7.10475
Display: PV450
I want to use a print statement along with the debug console to monitor entry into my scripts. When I try to connect to the debug console, I get the following message continually until I close the console window:
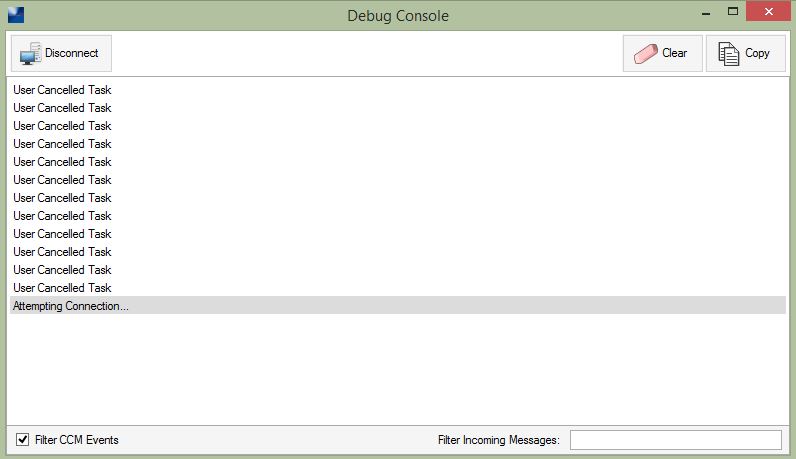
- Debug Console.JPG (39.09 KiB) Viewed 113 times
Am I missing a setting?
Thanks,
Dan
Happy New Year!
-
stalley
- Enovation Controls Development

- Posts: 618
- Joined: Tue Mar 18, 2014 12:57 pm
Post
by stalley » Mon Jan 05, 2015 1:10 pm
Hi Dan,
Happy New Year to you also.
Something is going on because I get the same thing that you describe, but it works just fine for others. Same PowerVision version and the standard PV450 config. I am perplexed.
The problem seems to be with the auto discovery in 2.7. This is what worked for me. You don't have to reboot the display or anything. Just go to the Network and Sharing of your computer and change the connection to the display to be the static IP address, 192.168.0.1/255.255.255.0
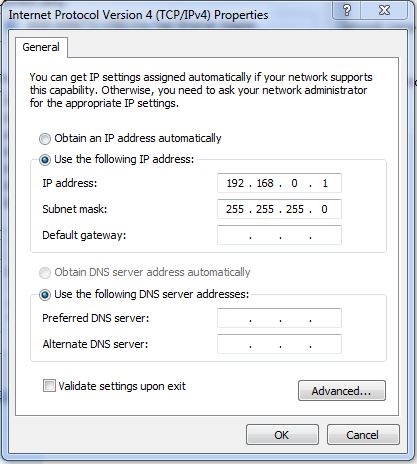
- Capture.JPG (47.27 KiB) Viewed 99 times
After I did this, I was able to connect to the debug console from PowerVision. It is strange since the Load works with the auto detect as does the Remote Diagnostics. For some reason the Debug Console only works with the static IP address.
Hope this will work for you also.
Sara Talley
Software Engineer
Enovation Controls
-
dmsellers
- Posts: 42
- Joined: Mon Aug 12, 2013 7:45 pm
Post
by dmsellers » Mon Jan 05, 2015 7:14 pm
Problem solved!
Thanks Sara,
Dan