Request New Features here.
-
ronaldbroth
- Posts: 15
- Joined: Wed Jun 14, 2017 12:45 pm
Post
by ronaldbroth » Wed Nov 29, 2017 12:56 pm
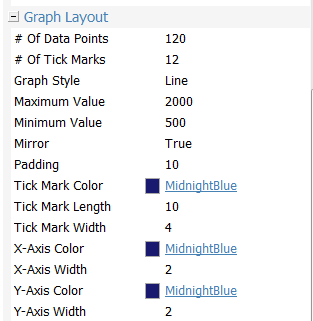
The graphing widget allows setting min/max limits on the y-axis.
Do you guys think you could allow setting min/max limits on the x-axis as well? Right now you can set the number of data points. If the plot data array has more points than the plot limits (e.g. plot array has 1000 data points) -- it would be great for my application to display portions of the data.
Just for more info -- I would like to "store" 7 days of data but only display 1 day of data at a time (i.e. Day 1, Day 2, ..., Day 7) per the User selection
- 11-29-2017 12-53-03.png (11.63 KiB) Viewed 63 times
Hope this makes sense.
Ron Roth
EControls, LLC
-
boyce
- Enovation Controls Development

- Posts: 322
- Joined: Wed Sep 08, 2010 5:09 pm
Post
by boyce » Thu Nov 30, 2017 9:18 am
Would it work if you defined 7 columns in the list for the 7 days data? You could define 7 graph widgets that are stacked and control the visibility for the widgets.
Boyce Schrack
Enovation Controls